Fasting glucose is the cheapest, oldest metabolic marker on the panel. Most clinicians treat the 100 mg/dL threshold as the action line. The longevity literature reads the within-normal-range gradient as well, and that gradient starts earlier. Use the biological-age calculator to see where your number lands in the Levine PhenoAge model and read this alongside the CGM article for the dynamic picture.
What is fasting glucose?
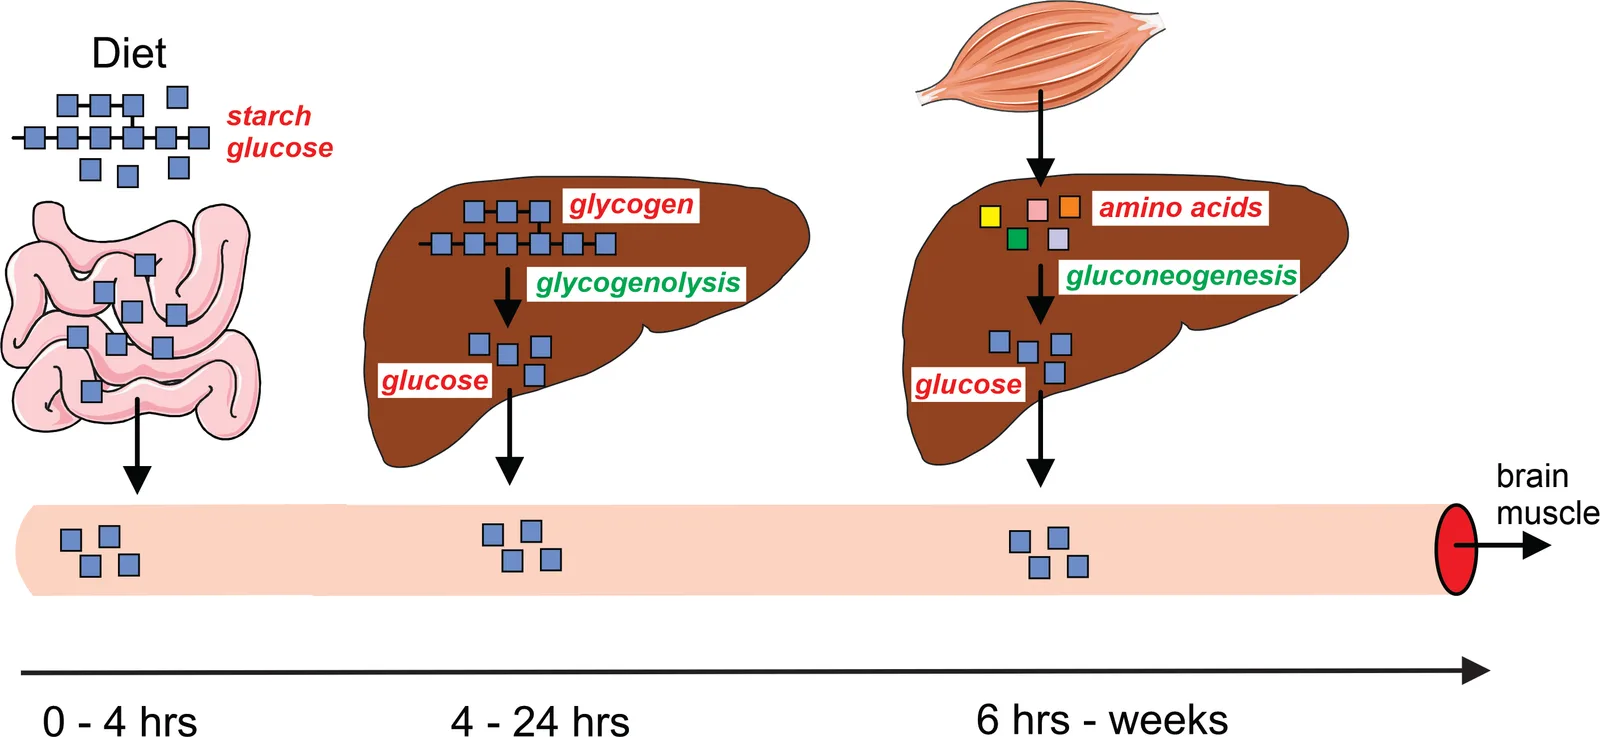
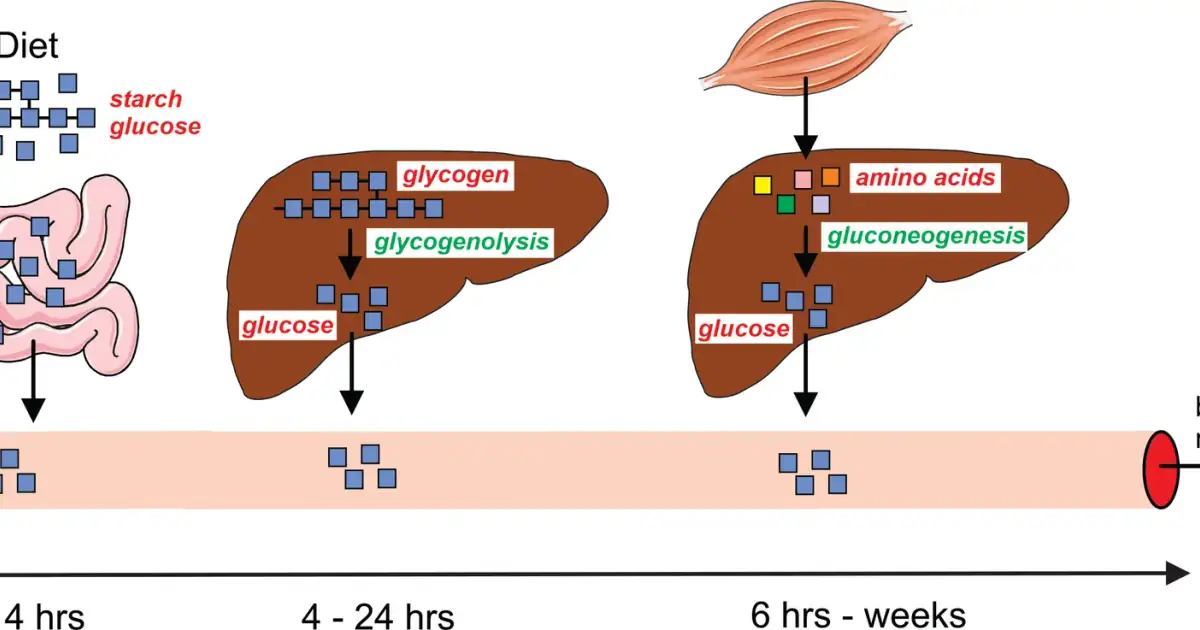
Fasting plasma glucose is the venous glucose concentration after at least 8 hours without caloric intake. The number reflects an equilibrium between hepatic glucose output (gluconeogenesis plus glycogenolysis) and peripheral uptake (mainly muscle and brain). In the fasted state, the dominant determinant is insulin sensitivity at the liver: insulin should be suppressing hepatic glucose output, and if it is not, fasting glucose drifts upward.
Diagnostic thresholds (ADA Standards 2024 American Diabetes Association 2023 ):
- <100 mg/dL (5.6 mmol/L): normal.
- 100-125 mg/dL (5.6-6.9 mmol/L): impaired fasting glucose, "prediabetes".
- >=126 mg/dL (>=7.0 mmol/L): diabetes, confirmed on a second test.
These are regulatory thresholds, calibrated for the cost-benefit of treating to prevent overt diabetes. They are not where biology pivots.
What is a normal fasting glucose range?
The within-normal-range gradient is real. Bjornholt et al. 1999 followed 1,933 nondiabetic Norwegian men for 22 years Bjornholt et al. 1999, n=1933 . Men with fasting glucose in the highest quintile of the normal range (85-99 mg/dL) had significantly higher cardiovascular mortality than men below 85, even after adjustment for BMI, smoking, lipids, and blood pressure. Multiple subsequent cohorts have replicated this pattern.
A reasonable longevity framing:
- 75-85 mg/dL: optimal.
- 85-90 mg/dL: still good; the upper edge of the optimal band.
- 90-99 mg/dL: monitor; pair with HbA1c and fasting insulin.
- 100-110 mg/dL: investigate; lifestyle is the front line.
- >110 mg/dL: clinical workup, GLP-1 or metformin discussion may be warranted.
For HbA1c context: <5.4% is the longevity-optimal band, 5.4-5.6% is the within-normal upper edge, 5.7-6.4% is prediabetes by ADA criteria. HbA1c integrates ~3 months of glycemia and is less noisy than a single fasting draw.
How it feeds into PhenoAge
Levine et al. 2018 included fasting glucose as one of the nine PhenoAge inputs Levine et al. 2018 . The coefficient is positive: higher glucose raises calculated phenotypic age. The slope is meaningful at the population scale; an adult at 95 mg/dL versus 80 mg/dL will show roughly 1-2 PhenoAge years of difference assuming the other inputs are equal. Above 110 mg/dL the slope is steeper. Run your number in the calculator to see the exact contribution.
The Levine formula does not include HbA1c, fasting insulin, or HOMA-IR; those are downstream measures of the same underlying physiology. PhenoAge captures the signal at one snapshot, which is why the calculator runs on a single CMP.
What does high fasting glucose mean?
Three mechanisms explain why elevated fasting glucose tracks mortality:
- Hepatic insulin resistance. Fasting glucose is the cleanest single readout of liver-level insulin resistance. The liver normally suppresses glucose output ~80% under fasting insulin; in insulin-resistant states, suppression drops to ~50-60%, and fasting glucose drifts upward.
- Glycation. Glucose reacts non-enzymatically with proteins to form advanced glycation end-products (AGEs). Higher mean glucose accelerates AGE accumulation in collagen, basement membranes, and lens proteins. The slope is gentle below 100 mg/dL and steepens sharply above 140.
- Vascular damage. Endothelial dysfunction associated with hyperglycemia begins below the diabetes threshold. The DECODE and Whitehall II cohorts show cardiovascular event gradients across the impaired-fasting-glucose band.
What drives it
Modifiable factors with quantified effects:
- Body fat, particularly visceral. A 5-10% body weight loss in overweight adults typically lowers fasting glucose 5-10 mg/dL within 6 months and improves HbA1c 0.3-0.5%. Above 10% weight loss the effect is larger; SURMOUNT-1-style tirzepatide protocols have produced fasting glucose normalization in over 90% of prediabetic participants.
- Resistance training and cardio. Each session improves insulin sensitivity for 24-48 hours; chronic adaptation is lower fasting glucose by 3-7 mg/dL after 8-12 weeks of consistent training.
- Carbohydrate quantity and timing. Reducing refined carbohydrate intake lowers fasting glucose modestly (3-8 mg/dL) and HbA1c 0.2-0.4% in non-diabetic adults at 12 weeks. Effects are larger in those with insulin resistance.
- Sleep. A single night below 5 hours raises next-morning fasting glucose 5-15 mg/dL transiently. Chronic short sleep raises baseline 3-5 mg/dL.
- Stress. Cortisol drives hepatic glucose output; chronic elevated cortisol raises fasting glucose. See the cortisol HPA axis article.
- Metformin. Lowers fasting glucose 10-20 mg/dL in prediabetic adults at 1,000-1,700 mg/day. See metformin for non-diabetics for the longevity context.
- GLP-1 receptor agonists (e.g. semaglutide). Larger effects via combined weight loss and direct glucose control.
What artificially raises a single reading
- A short or stressful sleep the night before (+5-15 mg/dL).
- A hard endurance workout within the prior 12 hours (+5-10 mg/dL via cortisol).
- Insufficient fasting (<8 hours).
- Acute illness or infection.
- Glucocorticoid medication.
A single fasting glucose of 105 in a previously-normal adult is a recheck, not a diagnosis. Repeat in 2-4 weeks; add HbA1c.
Cross-marker patterns
Fasting glucose plus fasting insulin gives the HOMA-IR index, a useful early-detection lens for insulin resistance. HOMA-IR = (glucose mg/dL x insulin uIU/mL) / 405. Values >2.0 suggest meaningful insulin resistance even when glucose is normal. The triglyceride/HDL ratio is another cheap proxy: above 2.0 in mg/dL units flags atherogenic dyslipidemia and tracks insulin resistance.
A 2-hour OGTT is more sensitive than fasting glucose for detecting impaired glucose tolerance, but it requires a clinic visit and a 75-g glucose load. For most adults, fasting glucose plus HbA1c plus fasting insulin is enough.
For the dynamic picture, a 14-day CGM trial reveals postprandial behavior the fasting number cannot. See CGMs for non-diabetics for the framework.
How to act on yours
Testing cadence:
- Healthy adult under 40: fasting glucose + HbA1c every 1-2 years.
- Family history, BMI >27, sedentary, or PCOS: annual, with fasting insulin.
- Any reading 100-125: 3-month recheck with HbA1c and fasting insulin; lifestyle changes first; clinician follow-up if unchanged.
- Two confirmed readings >=126: diabetes; clinical care.
If your fasting glucose drifts from 85 to 92 over 12 months: not panic territory, but a real signal. Look at body weight, sleep, training volume, and refined carbohydrate intake. Add an HbA1c. The cheap and effective interventions sit on the lifestyle side; pharmacotherapy comes later.
Counter-view
The "85 mg/dL fasting glucose is the new threshold" framing oversells the within-normal-range gradient. The Bjornholt mortality signal is real but small in absolute terms, and the residual confounding from insulin resistance, body composition, and underlying inflammation is hard to fully control. Some clinicians (Layne Norton, Spencer Nadolsky) push back on aggressive within-normal-range targeting, arguing the upstream lever (body composition, fitness) matters more than chasing the glucose number itself. They have a point: a fasting glucose of 92 in a lean, fit, non-insulin-resistant adult is not the same problem as 92 in a sedentary obese one. Treat the underlying metabolic context, not the number in isolation.